Phone: +91-9310885321
 Email: support@learnhub4u.com

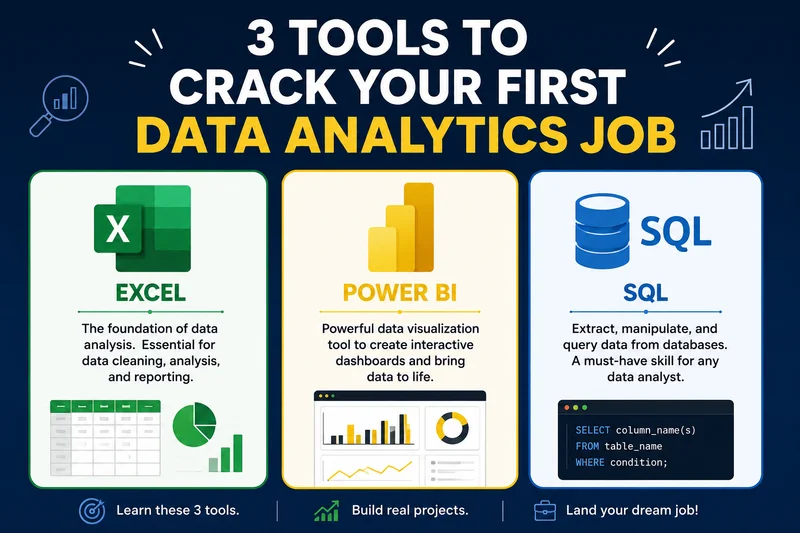
Forget the Hype: You Only Need 3 Tools to Crack Your First Data Analytics Job
Let’s be honest for a second. If you open up LinkedIn or scroll through tech Twitter right now, the advice for breaking into data analytics is a complete mess. You’ll see self-proclaimed gurus telling you that you need to master Python, learn advanced machine learning, memorize R programming, and master three different cloud platforms just to land a basic, entry-level job.
Honestly? It’s complete garbage, and it’s keeping people stuck.
When we talk to students at Learnhub Education, the biggest roadblock isn't that they aren't smart enough; it's that they are drowning in "tutorial hell." They spend months watching 80-hour video courses on complex coding, get overwhelmed, and quit before they even apply for a single role.
Here is the reality of the actual job market: you don’t need to know everything. If you can master just three basic tools—Excel, SQL, and Power BI—you can easily handle 80% of the junior data analyst jobs out there.
Let’s talk about how these three actually fit together in the real world, and how you can learn them without losing your mind.
1. Stop Hating on Microsoft Excel
It’s trendy for developers to laugh at Excel and call it outdated. Don't fall for it.
The smartest analysts know that Excel runs the business world. Senior managers live in spreadsheets. Finance teams breathe them. If you cannot navigate a basic Excel sheet, you are going to struggle heavily in a corporate environment. It’s the best place to start because it lets you actually see your data in front of you.
You don’t need to memorize all 500 functions. Just focus on three things:
Lookups (XLOOKUP/VLOOKUP): Because you'll constantly need to grab data from one sheet and connect it to another.
Pivot Tables: This is where you do the actual analyzing. If you can take 5,000 messy rows of sales data and summarize them into a neat table in three clicks, you're doing great.
IF Statements: Basic logic to help you clean up messy data columns.
2. SQL is Your Actual Ticket to a Job
Excel is great, but it has a massive weak spot: it breaks down when data gets too big. If you try to load a file with two or three million rows of data, Excel will freeze, your laptop fan will start screaming, and the program will crash.
That’s why companies use databases, and why SQL (Structured Query Language) is non-negotiable. SQL is just the language you use to talk to those massive data storage units. It looks like code, but it's really just structured English.
Forget trying to memorize massive walls of coding syntax. Honestly, to get started with SQL, you only need to know how to do two things:
Use
SELECTandFROMto pull the exact columns you actually want to look at.Use
WHEREto narrow down your list (like, "only show me users who bought something today").Filter out the noise using WHERE (e.g., "only show me users who bought something today").
Group things together using GROUP BY to get quick totals or averages.
Smash tables together using JOINS (which is just the database version of an Excel lookup).
3. Power BI is How You Show Off Your Work
Great, so you used SQL to pull a million rows of data, and you used Excel to double-check the math. Now what?
You can't just hand a giant wall of numbers to your boss or a client. They don’t have the time or the patience to read through rows of data. They want answers, fast.
This is where Power BI comes in. It’s your storytelling tool. It takes that raw, boring data and turns it into clean, interactive dashboards. Instead of emailing your team a static spreadsheet every Monday, you give them a Power BI link where they can click a button and see sales charts update instantly.
When learning Power BI, don't get distracted by making things look pretty with neon colors and 3D effects. Focus on Data Modeling (making sure your tables connect properly) and Basic DAX (Power BI’s formula language, which looks a lot like Excel).
The 8-Week Blueprint (How to Actually Learn This)
The biggest trap is spending all your time watching videos without actually building anything. You will learn more from fixing one broken error message on your own screen than from watching ten hours of a lecture.
At Learnhub Education, we always recommend a hands-on, project-first approach. Break it down into two-month chunks:
Weeks 1 & 2: Go to a free site like Kaggle, download a fun dataset—like Netflix movie logs or Spotify streaming stats—and just mess around with it in Excel. Build some pivot tables and see what trends you can find.
Weeks 3 to 5: Grab a free tool like PostgreSQL and throw a real dataset into it—something fun like a Netflix movie list. Spend these weeks just messing around with simple queries to answer random questions, like seeing which directors actually made the longest movies.
Weeks 6 to 8: you can connect that database to Power BI and spend another couple of weeks building a clean, single-page dashboard to visualize what you found. That's the whole workflow right there.
Conclusion
At the end of the day, companies don't hire people because they have a collection of course certificates on their LinkedIn profile. They hire people who can solve business problems.
By focusing entirely on the core trio of Excel, SQL, and Power BI, you aren't spreading yourself too thin. You are building a sharp, practical skillset that applies to almost every business on earth.
Spend less time worrying about which tool is the fanciest, and spend more time actually clicking around and building projects. That’s how you build real confidence, and that's exactly how you get hired.
FAQS:
1. Is Excel still relevant in 2026, or is it dying out?
It’s not going anywhere. People have been predicting the death of Excel for twenty years, yet it still runs the global business economy. Think of it this way: every manager, client, and CEO knows how to open an Excel sheet. Even if you do heavy database work, stakeholders will almost always ask you to "just export it to Excel" so they can look at it.
2. What is the actual difference between SQL and Excel?
Size and speed. Excel physically stores data in a grid on your local machine and slows down heavily if you pass a few hundred thousand rows. SQL doesn’t store data on your screen; it lives on a server. SQL is just the language you use to pull specific chunks out of massive databases containing billions of rows without crashing your computer.
3. Which should I learn first: Power BI or Tableau?
Honestly, they do the exact same job, so pick one and stick to it. We recommend Power BI because it integrates seamlessly with Excel and windows environments, making it a favorite for thousands of corporate companies. Once you master the logic of building dashboards in Power BI, switching to Tableau later takes less than a week.
4. How much math do I actually need to know day-to-day?
Basic school-level math—addition, subtraction, percentages, and averages—will get you through 90% of your daily tasks. You don’t need calculus. You just need to understand descriptive statistics, like the difference between the mean (average) and median, so you don't misrepresent your data.
5. What is "tutorial hell," and how do I avoid it?
Tutorial hell is when you spend months watching online courses, copying exactly what the instructor types, and feeling smart—but the moment you open a blank file on your own, you have no idea what to do. You avoid it by stopping the video every 10 minutes and trying to break the code or build something different with the same tool.
6. Where can I find free data to practice on?
Kaggle is the absolute best place to start. It has thousands of free, real-world datasets on everything from sports stats and Netflix trends to retail sales. You can also check out government websites or Google’s Dataset Search. Pick a topic you actually enjoy so you don't get bored.
7. How do I put a project on my portfolio if I don't have a website?
You don't need a fancy personal website. You can publish your SQL code on GitHub, write up your findings as a short post on Medium or LinkedIn, and upload your Power BI dashboards to the Power BI Public Web gallery. Just share a link that lets hiring managers see your work clearly.
8. How long will it take me to learn these three tools from scratch?
If you consistently spend 1 to 2 hours every single day practicing, you can build a decent foundation in about 8 weeks. Spend two weeks on Excel, three weeks on SQL, and three weeks on Power BI. The key word here is practicing, not just watching videos.
9. Is Power BI hard to learn if I’ve never done design work?
Not at all. Power BI handles the heavy visual lifting for you. Your job isn't to be an artist; it's to be clear. If you stick to simple bar charts, line graphs, and clear numbers, and avoid messy neon colors or confusing 3D layouts, your dashboards will look professional.
10. How does Learnhub Education help me skip the generic AI learning traps?
At Learnhub Education, we cut out the filler. We don't make you sit through hours of theoretical lectures or teach you tools you won't use on day one. We focus entirely on hands-on, project-first learning so you spend your time building a real portfolio that stands out to hiring managers.