Phone: +91-9310885321
 Email: support@learnhub4u.com

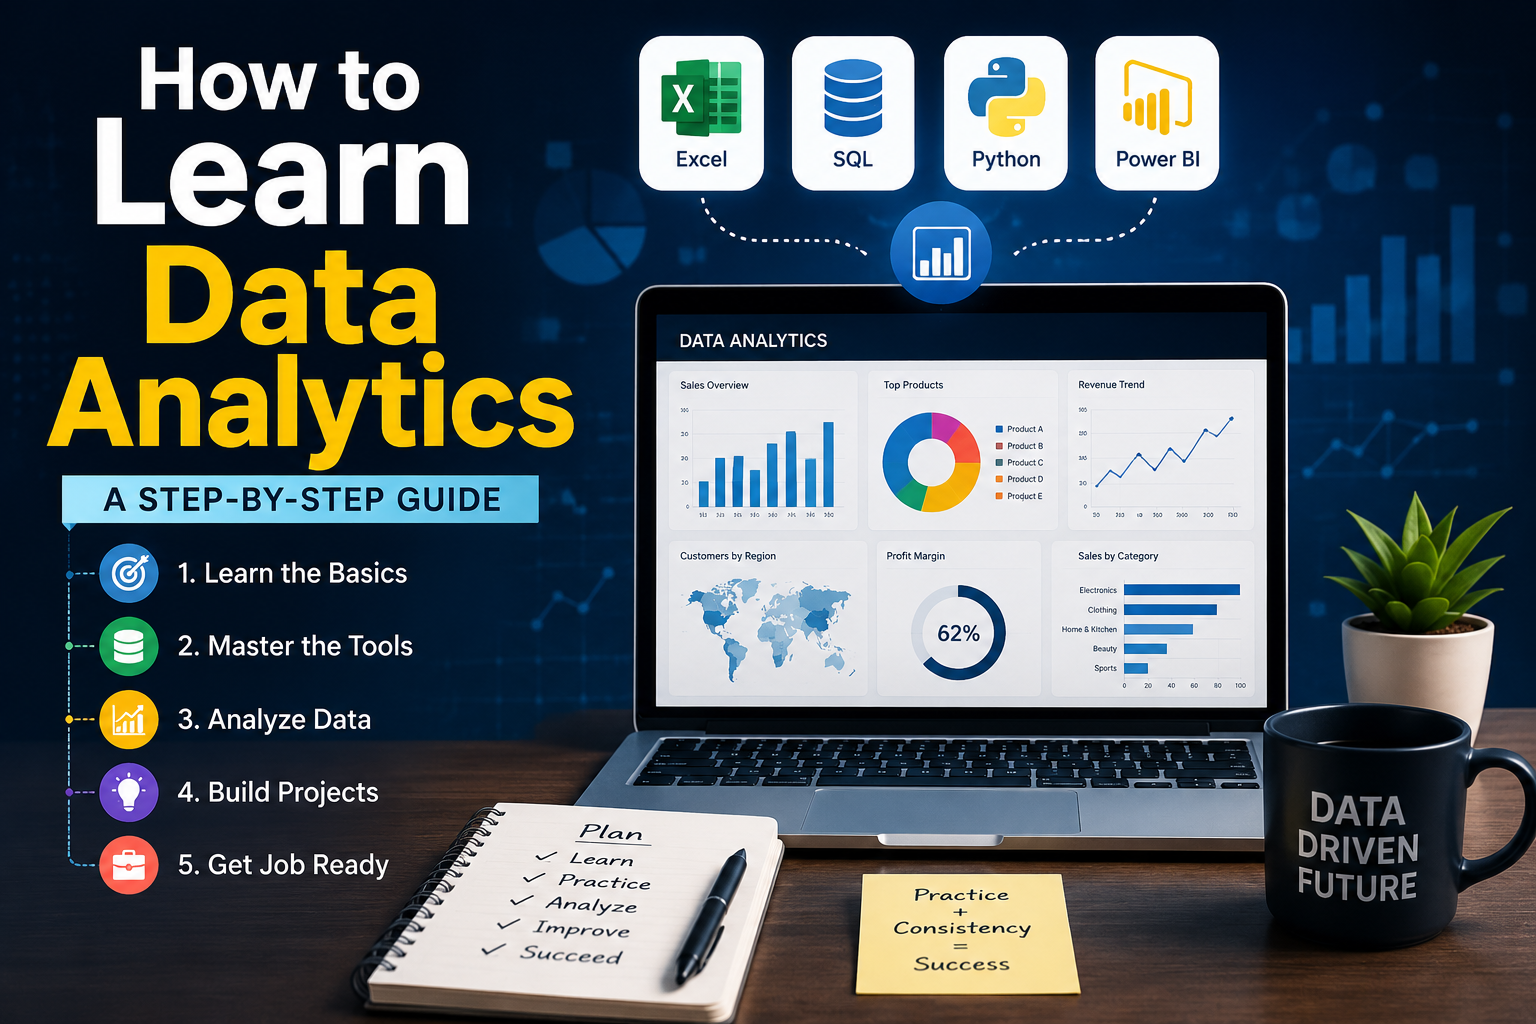
1. Start with Excel (Don't Skip This)
I know coding sounds cooler, but if you skip Excel, you are going to struggle. Every company on earth relies on spreadsheets. If you get an entry-level job, your boss isn't going to hand you a complex script; they’re going to hand you an Excel sheet.
You don't need to know the thousands of weird features hidden in Excel. You just need to get really good at three things:
Pivot Tables: This is just a quick way to crush a massive list of thousands of sales into a tiny, readable summary in about three clicks.
XLOOKUP: Think of this like a search bar that connects different sheets. If you have a customer ID on one sheet and their phone number on another, XLOOKUP glues them together.
SUMIF and COUNTIF: These let you add or count things only if they meet a specific rule—like adding up total revenue, but only for products sold in Mumbai.
Find some messy data online, practice cleaning out the blank rows and duplicates, and make a few simple bar charts. Once you can do that without sweating, you're ready for step two.
2. Learn SQL for Big Data
Excel is awesome, but if you try to open a file with three million rows, your laptop will start making loud noises and freeze. That’s why companies use databases. To talk to these databases, you use a simple language called SQL.
Don't let the word "language" scare you. SQL reads like broken English. You are literally just typing out what you want the computer to pull from the warehouse.
A typical command looks like this: SELECT customer_name FROM sales WHERE amount > 5000. You are just telling the system: "Hey, give me the names of people who spent more than 5,000 rupees."
Spend a few weeks practicing how to filter data, how to group it by categories, and how to link two different tables together. There are tons of free websites where you can practice writing these queries right inside your browser without installing anything.
3. Pick One Visualization Tool
Nobody in management wants to stare at a giant spreadsheet or lines of SQL code. Their eyes will glaze over immediately. They want answers fast. Your job is to take those numbers and turn them into a picture.
You need to learn a data visualization tool. The two heavyweights are Tableau and Power BI.
Do not waste your time trying to learn both. It doesn’t matter which one you pick—just choose one, download the free version, and get comfortable with it. Learn how to build basic line graphs, bar charts, and interactive dashboards. The goal here isn’t to make art; it’s to make the chart so incredibly simple that a manager can look at it for five seconds and understand exactly why sales went down last week.
4. Learn a Little Bit of Python
Once you know Excel, SQL, and a viz tool, you can honestly start applying for jobs. But if you want to stand out, learn a bit of Python.
Here is the secret: you are not trying to become a software engineer. You don't need to know how to build apps, websites, or video games. You are only using Python as a super-powered calculator to clean up data.
Focus entirely on a library called Pandas. It is basically Excel, but completely controlled by code. It allows you to automate boring, repetitive tasks and handle massive files that would normally crash your computer. Keep it basic. You don't need to touch complex AI or machine learning algorithms right now.
The Step That Actually Matters: Stop Watching, Start Doing
The biggest trap students fall into is what I call "tutorial hell." You watch fifty videos, feel like you're learning, but the moment you open a blank screen, you have no idea what to do. You only truly learn when you try to build something without a video telling you the answers.
Do not do the generic projects everyone copies from YouTube, like the Titanic dataset. Recruiters see that specific project ten times a day and immediately throw the resume in the trash.
Find data on something you actually give a damn about:
If you love cricket or football, find a dataset of player stats and try to figure out who the most undervalued player is.
If you are into movies or anime, analyze streaming data to see if longer runtimes lead to worse audience reviews.
If you want to look at your own life, export your personal Spotify listening history or Amazon orders and analyze your own habits.
Clean the data, build a simple dashboard to show your findings, and write a short paragraph explaining what you discovered. Put it on a free GitHub page or a basic website. Having just one project where you found a real piece of information on your own is worth more than a mountain of online certificates.
Keep the Momentum Small
You cannot cram all of this into your brain over a single weekend. If you try to study for nine hours straight on a Saturday, you’ll get frustrated and quit by Monday.
Instead, just give it 45 minutes a day. Practice a few SQL queries on Monday, play with a spreadsheet on Tuesday, and look at a Tableau chart on Wednesday. Over three to four months, those tiny daily habits build up into serious skills.
If you ever get stuck, or if you just want a straightforward, practical environment to learn this stuff without the usual corporate jargon and academic fluff, come look at what we do at Learnhub Education. We keep things simple, real, and focused purely on what actually matters to get your foot in the door.
Stop overthinking the roadmap, stop collecting courses you won't finish, and go download a random dataset to mess around with today!
FAQs:
1. Do I really need to be a math genius to do this?
Honestly, no. If you can handle basic school-level math—addition, subtraction, averages, percentages, and fractions—you know enough to start. The computer does all the heavy calculations for you. Your job isn't to do the math; it’s to look at the result and figure out what it means for the business. Don't let a fear of math keep you out of this field.
2. Can I get a data analyst job without a college degree?
Yes, but you have to prove you can do the work. A college degree makes passing the initial resume check easier, but a killer portfolio of real projects matters way more to a hiring manager. If your portfolio shows you can pull data from a database, clean it up, and find insights that save a company money, that carries real weight.
3. Which tool should I learn first, Excel or Python?
Start with Excel. No matter how fancy Python sounds, Excel is still the backbone of almost every business on earth. When you start your first job or internship, your boss is going to throw an Excel sheet at you long before they give you access to a Python environment. Learn how to navigate a spreadsheet first, then move to coding.
6. How much python code do I actually need to know?
You only need to know a fraction of what a software developer knows. You don't need to build apps, create websites, or code games. You just need Python to manipulate data. Focus entirely on learning basic syntax (loops, variables) and then dive straight into a library called Pandas, which is essentially a super-powered version of Excel handled through code.
7. What is "tutorial hell," and how do I get out of it?
Tutorial hell is when you spend months watching videos, copying exactly what the instructor does, and feeling like you understand it—but the second you open a blank screen to work on your own, you freeze up completely. The only way out is to stop watching. Force yourself to build a project from scratch without a video guide. Getting stuck and searching Google for the answer is how you actually learn.
8. Where can I find free data to practice on?
Kaggle is the most popular place, but because every student uses it, the datasets can feel a bit repetitive. You can also use Google Dataset Search, or look through subreddits like r/datasets. Another great trick is to export your own data—like your personal Spotify streaming history, your screen time logs, or your digital bank statements—and analyze yourself.
11. How long does it realistically take to become job-ready from scratch?
If you hear someone claim you can become a data analyst in two weeks, they are lying to sell you something. If you study consistently for about 45 minutes to an hour every single day, it realistically takes around 4 to 6 months to get comfortable with the tools, build a couple of solid portfolio projects, and start confidently applying for entry-level roles.
15. Where can I find a community or structured help when I get stuck?
Learning alone in your room can get lonely and frustrating very quickly. Having a community to check your work, answer your bugs, and guide you makes a world of difference. If you want structured, step-by-step guidance that cuts through all the internet noise and focuses purely on getting you job-ready, come check out our student community at Learnhub Education. We keep things simple, practical, and real.