Phone: +91-9310885321
 Email: support@learnhub4u.com

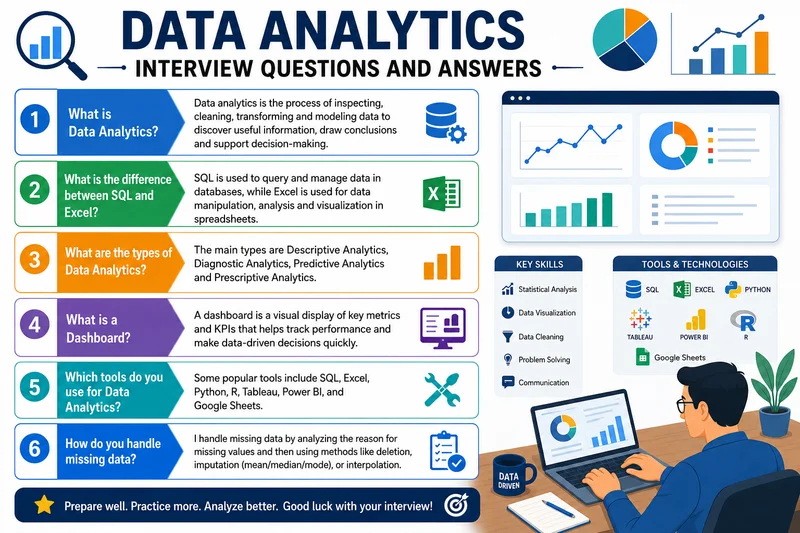
Bouncing Back from “I Don’t Know”: The Data Analytics Interview Questions That Actually Matter
If you’re reading this, your stomach is probably doing small flips right now. You have an interview lined up. Maybe it’s next week, maybe it’s tomorrow morning, or maybe you just wrapped up a mock interview with us at Learnhub Education and realized your explanation of a basic SQL join sounded like you were trying to describe a multi-car pileup.
First off: take a second and breathe.
Data analytics interviews are weirdly brutal because they force you to use two completely opposite sides of your brain. On one hand, they expect you to act like a human computer who writes flawless window functions on a whiteboard without sweating. On the other hand, they want a charismatic storyteller who can walk into a boardroom and explain to a stressed-out marketing manager why their favorite campaign is bleeding money.
We aren't going to waste your time with a dry list of fifty textbook definitions you could easily find on Wikipedia five minutes before your call. Instead, let's talk about the exact technical, statistical, and behavioral situations that data managers love to throw at people—and how you can answer them like a real human being, not a robot reading off a slide deck.
1. The SQL Reality Check: It’s About Flow, Not Just Syntax
You can’t really fake your way through the SQL portion of an interview. It’s the absolute bread and butter of the job. But here is a secret: experienced hiring managers don’t just care if you remember where the semicolons go. They want to see how you visualize data moving through a server.
When they ask you about WHERE versus HAVING:
Most self-taught students fall right into a trap here. They say something rigid like, "WHERE filters rows and HAVING filters groups." While that is technically true, it doesn't tell the interviewer anything about your actual thought process.
Try explaining it like a physical sorting process instead. Tell them it’s a two-stage filtration pipeline:
The WHERE clause is your first gatekeeper. It looks at every single raw row before any math or calculations even happen. If your company only cares about transactions from 2026, WHERE drops everything else into the trash immediately.
The HAVING clause is your second gatekeeper, but it stays asleep until after you have grouped your data together using a GROUP BY command. If you group your sales data by city and want to isolate the specific cities that pulled in more than $50,000 in total revenue, you have to use HAVING SUM(sales) > 50000. You can’t use WHERE for that because an individual raw row doesn't know what the city's grand total is yet.
When they ask what you’d do with a dataset that has 20% missing values:
The biggest mistake you can make here is jumping straight to an automated fix. If you say, "I would immediately delete those rows" or "I’ll just fill them in with the average value," the interviewer is going to worry that you're reckless with company data.
A seasoned analyst takes a step back. Your answer should sound more like a detective solving a mystery:
"Before I write a single line of code to fix it, I need to figure out why that data is missing in the first place. Is it a technical glitch—like a data pipeline failing for a week—or did users simply skip an optional question on a web form? If it’s a system glitch and I throw away twenty percent of our rows, I might ruin the entire analysis. In that case, I'd look into imputation, maybe using the median if the data has wild outliers. But if it was just an optional form field, that empty space is actually useful data on its own. It tells me something about user behavior, so I might just label it 'Not Disclosed' and keep moving."
2. The Math Intuition: Ditching the Jargon
Statistics can make anyone’s palms sweat, but interviewers are usually testing your common sense, not your ability to calculate formulas by hand.
When they ask you to explain Correlation versus Causation:
Please don’t start rattling off textbook talk about Pearson correlation coefficients or mathematical variables unless they specifically ask you to calculate something. Use a relatable, slightly absurd example instead. It shows you actually get it.
Tell them about the classic ice cream and shark attack problem. Every summer, ice cream sales spike sky-high. At the exact same time, shark attacks spike too. If you plot them on a line chart, they move up and down together perfectly. That is correlation—the lines look like they are dancing together.
But buying a scoop of chocolate chip obviously doesn't cause a shark to bite you. The hidden variable driving both metrics is the hot summer weather. The heat causes people to buy ice cream, and it also drives people into the ocean to swim. That underlying driver is the causation. As an analyst, your job isn't just to spot things that move together; it's to dig underneath the surface and find out what is actually forcing the gears to turn.
3. The Visualizations: Designing for Impatient Executives
At Learnhub Education, we drum this rule into our students constantly: A beautiful dashboard that nobody understands is completely useless. You are the bridge between a messy SQL database and a busy corporate executive.
When they ask how you choose between a Bar Chart and a Histogram:
They look pretty similar at a glance, so people often stutter here. Keep it simple and focus on the type of data you are dealing with.
If you are comparing entirely separate, distinct categories—like total sales figures across five different countries—you reach for a Bar Chart. The categories have distinct gaps between them because Germany and Japan don't bleed into each other.
But if you want to look at a single, continuous numerical spectrum to see where the crowd is clustering—like breaking down your customer base into age ranges (, , )—you use a Histogram. The bars touch each other on purpose because time and age are continuous. It lets a business executive instantly see where the bulk of their audience lives.
4. The Soft Skills: Surviving the "I Don't Know" Moment
The technical questions only get you through the door. The behavioral questions are what convince a manager to actually sit next to you for forty hours a week.
When they ask: "What do you do if a director asks a question about your data during a live meeting, and you don't know the answer?"
A lot of junior candidates panic, get defensive, or worse—they try to wing it and guess a number on the spot. Don't do it. Experienced managers can smell a fake answer instantly, and the moment they catch you guessing, you lose all your credibility.
A real, honest answer sounds like this:
"I would never make up a number on the spot just to look smart. If a director makes a major business decision based on a guess I made under pressure, that puts the company at risk. Instead, I’d take a breath and say: 'That is a really sharp question. I don't want to give you a rough estimate off the top of my head because I want to ensure it's accurate. Let me write that down, run a quick query against the raw data right after this meeting, and send the exact breakdown to your inbox by two o'clock today.'"
Trust Your Process
When you step into that room, remember that the interviewer isn't an all-knowing judge trying to trick you. They are usually just a tired team lead who has a mountain of data problems to solve and wants to hire someone reliable, logical, and easy to talk to.
They want to hear about your projects. They want to hear about the time you spent four hours sweating over a broken CSV file, or how you built a project that proved a client was losing money on a broken website link.
If you want to practice these kinds of conversations without the corporate fluff, that is exactly what we do in our mock sessions at Learnhub Education. We don't just teach you the syntax; we teach you how to talk about your work like a colleague. Speak slowly, treat the interview like a collaborative puzzle, and just be yourself. You've got this.
FAQs:
1. What if I completely forget the syntax for a SQL query mid-interview?
Don't just sit there sweating in silence. The worst thing you can do is freeze up and stare at the screen. Just open your mouth and tell them your thought process out loud. Say something like: "Honestly, my brain is short-circuiting on the exact word for this function right now, but here is what I am trying to do logically. I need to isolate this column first, group it by user ID, and then filter out the duplicates." Most interviewers will literally smile and give you the keyword because they care way more about your logic than you memorizing code like a parrot.
2. Do I really have to be a math genius to pass the statistics part?
No, and honestly, don't let anyone intimidate you into thinking you do. Unless you are applying for a heavy machine learning role, nobody is going to hand you a calculator and make you compute formulas by hand. They want to see your intuition. They want to know if you look at a massive spike on a chart and think: "Wait, is that a real trend, or did a tracking script break on our website?" It's about common sense, not memorizing textbooks.
3. What is a Left Join in a way that actually makes sense?
Imagine you have two sheets of paper. Sheet A is a list of every single student enrolled at Learnhub Education. Sheet B is a list of students who signed up for the soccer club. A Left Join keeps Sheet A completely intact. You get every single student's name, no matter what. If they happen to be on Sheet B too, it pastes their soccer details next to their name. If they aren't, it just leaves that space blank. You use it because you don't want to accidentally delete students from your main list just because they don't play soccer.
4. What do I do if they hand me a take-home assignment that takes way too long?
Set a strict boundary for yourself. If a company sends you a test that requires twenty hours of free labor, that’s a red flag. But for a normal assignment, focus heavily on your presentation. Don't just send back a giant, messy notebook of code. Write a quick three-sentence summary at the very top explaining what you discovered. Assume the hiring manager is busy and will only look at it for two minutes. Make your charts clean and your conclusions obvious.
5. Why do companies care so much about Excel if they are hiring a "Data Analyst"?
Because the entire business world runs on Excel. You might write the coolest SQL queries and Python scripts in the world, but the finance director or the marketing lead isn't going to open a Jupyter Notebook. They want an Excel sheet. You need to show you can export your data and format it into a pivot table or a clean sheet that a regular person can actually use to make decisions.
6. How do I stand out if my portfolio projects look exactly like everyone else's?
Stop using the standard datasets that everyone downloads from Kaggle, like the Titanic passenger list or housing prices. It makes you look like you just copied a classroom tutorial. Instead, scrape data about something you actually care about—like your favorite video game, local restaurant reviews, or sports stats. When you talk about something you genuinely find interesting, your voice changes, you get excited, and the interviewer will actually remember you.
7. How do I explain a Histogram to my grandma?
Tell her it’s just a bar chart, but instead of comparing separate things like apples and oranges, it clumps numbers into buckets. If you want to see how old the people at a party are, you make buckets for kids, teenagers, adults, and seniors. A histogram shows you which bucket is overflowing with people so you know exactly who showed up.
8. Is it okay to tell an interviewer that I don't know an answer?
Yes! In fact, lying or guessing a random number is the fastest way to get rejected. If you guess, they think you'll do that on the job and cost the company money. Just say: "I haven't worked with that specific tool or scenario yet, but based on what I know about data pipelines, I guess the first step would be to check X, and I'd be happy to look up the exact method right after this call."