Phone: +91-9310885321
 Email: support@learnhub4u.com

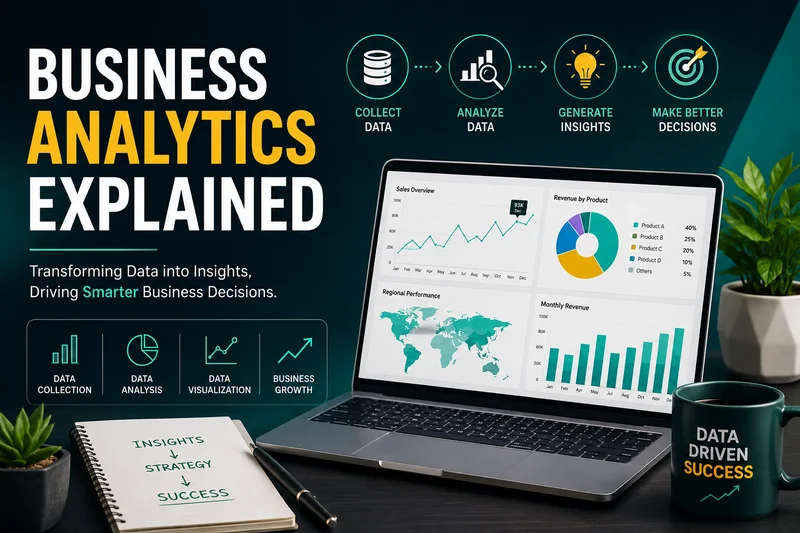
What Actually Is Business Analytics?
Strip away all the tech jargon, and business analytics is just one thing: using facts to stop guessing.
Think about how most people run things when they don't have data. They rely on a "gut feeling." If a clothing store is losing money, the owner might guess, "Oh, maybe people don't like our winter jackets." So, they put them on sale, lose a bunch of profit, and then realize people weren't buying them simply because the store's website launcher was broken on mobile phones.
An analyst is the person who stops the company from making those blind, expensive guesses. They look at the trail of digital breadcrumbs we all leave behind—every click, every swipe, every purchase—and use that info to figure out what's actually happening. It’s like being a detective, but for a business.
The Four Questions You Need to Ask
Instead of memorizing definitions from a lecture slide, think of analytics as four simple questions you ask when trying to solve a problem.
1. "What happened?" This is the absolute baseline. You are just looking at past data to see the facts. Think of it like checking your bank statement at the end of the month. It tells you exactly how much money you spent. It won't tell you why you bought three hoodies you didn't need, but it gives you the raw reality of where your cash went.
2. "Why did it happen?" Once you see a trend, you have to dig for the cause. If your bank statement shows you spent a massive amount of money on Tuesday, you look back at your calendar and think, "Ah, that was the day my car broke down and I had to pay for a tow truck." You found the specific trigger behind the number.
3. "What might happen next?" Now you start looking forward. You take what you know about the past and make an educated guess about the future. If you notice you spend an extra $40 on coffee every single time exam week rolls around, you can predict that next month—when finals hit—your coffee spending is going to spike again. It’s not a magic crystal ball; it’s just spotting a pattern and playing it forward.
4. "What should we do about it?" This is where the real value is. It’s about making a plan based on your prediction. Think about how Google Maps works. It looks at live traffic ahead (what happened), calculates that you'll be stuck for 30 minutes (what will happen), and then automatically tells you to take a side street to save time (what you should do). That is the ultimate goal of analytics: giving a clear recommendation.
Why This Field is Drastically Growing
If you’re a student right now trying to figure out what career path makes sense, you need to understand the current job market.
Right now, every single company on earth is completely drowning in data. Spotify tracks every second of music you listen to. Amazon tracks how long you hover your mouse over an item before buying it. Netflix knows exactly when you pause a show to go get a snack.
But here’s the catch: raw data is completely useless on its own. It’s just a massive, terrifying wall of numbers that no manager has the time or patience to look at.
Companies are absolutely desperate for people who can look at that giant mess, find the story hidden inside it, and explain it to them in plain, simple English. That’s why business analytics is one of the fastest-growing fields out there. It sits right in the middle of business strategy and technology.
And let's clear up the biggest myth right now: you do not need to be a math genius to do this.
At Learnhub Education, we see so many students walk away from analytics because they think it requires insane calculus or high-level coding. It doesn't. Modern software handles the heavy math for you. What you actually need is curiosity. You need to be the kind of person who looks at a problem and wants to know the real reason behind it, rather than just taking things at face value.
How to Start Building the Skill Set
If you want to actually get into this, you don’t need to learn twenty different things at once. Just focus on three basic steps:
Learn to clean up the mess: Real-world data is incredibly dirty. People make typos, leave fields blank, or enter information twice. A huge part of the job is just organizing the data so it’s accurate. Think of it like washing and prepping your ingredients before you start cooking a meal.
Master the basics first: You don't need to learn complex AI programming on day one. Honestly, being incredibly good at Microsoft Excel is a massive superpower that can land you your first internship. Once you have that down, you can move on to learning SQL (which is just a way to talk to databases) or tools like Tableau to make clean, easy-to-read charts.
Learn to tell a story: This is the skill most tech students completely ignore. You can build the most complicated data model in the world, but if you can’t explain your answer to a manager who knows nothing about data, your work is useless. You have to be able to talk like a regular human being and explain why your numbers matter to the business.
The Bottom Line
Business analytics isn't about the tools, the software, or the math. It’s a mindset. It’s about being a problem solver who uses facts instead of guesswork to find the truth.
If you can learn how to look at a messy situation, pull out the facts, and communicate a clear solution, you will always be in demand, no matter what industry you end up in.
FAQs:
1. Be honest, do I have to be great at math?
No. I say this to everyone because people freak out about it. If you can do basic subtraction, calculate a percentage change, and understand what an average means, you are fine. The software on your laptop handles the actual math. Your job is just to look at the final number and say, "Okay, what does this mean for our sales?"
4. What tool should I actually learn first?
Excel. Don't let anyone tell you it’s outdated. If you can confidently use a pivot table and look up data across sheets, you can handle most entry-level internship tasks. Once you get that down, learn SQL. That’s the tool used to pull data out of big company databases.
5. Why do people still use Excel if we have AI?
Because every boss on the planet knows how to open an Excel sheet. You can build the most advanced, high-tech AI model in the world, but when the VP of Marketing wants to see the weekly results, they’re going to ask you to email them an Excel file or a quick PowerPoint slide. It’s the universal language of business.
7. Do I absolutely need to learn Python?
Not on day one. For a lot of entry-level business analyst jobs, you won't touch Python at all. It’s a great tool to learn later on if you want to handle massive datasets that crush Excel, but don't stress about it when you're just starting out.
9. How does Netflix use this to keep us watching?
They track everything you do. They know exactly when you pause a video, when you fast-forward, and what thumbnails you click on. If the data shows that millions of users who watched a specific crime thriller also clicked on a documentary about cults, the system automatically pushes that documentary to the top of your home screen.
1. Is this career choice safe for the next few years?
It's incredibly safe. Companies are collecting more information than they know what to do with. They have endless spreadsheets and logs, but they have no idea what any of it means. As long as businesses need to make money and cut costs, they will always need people who can read the numbers.
13. What is data visualization?
It’s literally just making charts. No manager wants to look at a spreadsheet with 50,000 rows of raw data; their eyes will just glaze over. Data visualization is the art of turning that giant mess into one clean bar graph that shows the problem instantly so the team can make a quick decision.
14. How do we teach this at Learnhub Education?
We don't make you memorize textbook chapters or regurgitate definitions for a written exam. At Learnhub Education, we give you the kind of messy, imperfect datasets you’d actually find at a real company. You learn by fixing them, finding the trends, and practice explaining your answers out loud.
15. What's the most important trait to have?
Just being curious. You have to be the type of person who looks at a weird dip in a chart and actually wants to dig around to figure out why it happened. If you naturally like solving puzzles and asking "why," you already have the most important skill for this job.