Phone: +91-9310885321
 Email: support@learnhub4u.com

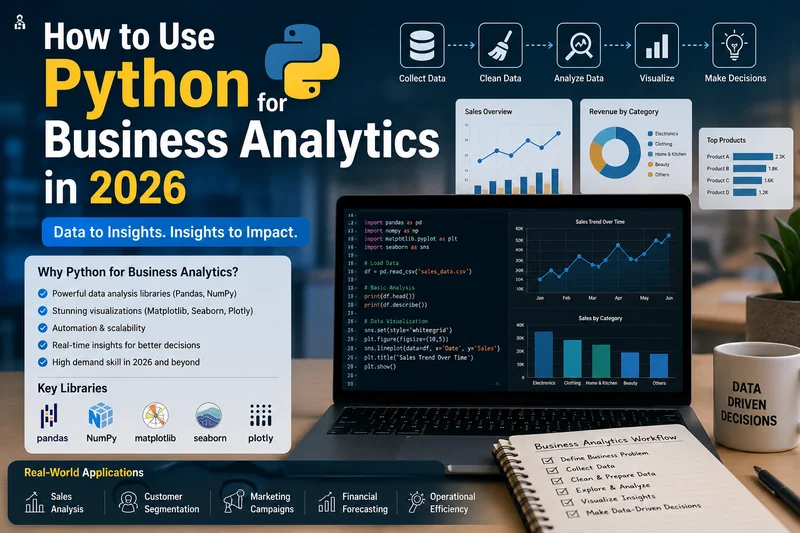
How to Actually Use Python for Business Analytics in 2026 (Without Being a Coding Genius)
Let’s be honest. If you’re trying to break into business right now, the old advice is pretty much useless. Remember when knowing a VLOOKUP or building a basic pie chart in Excel made you the smartest person in the room? Yeah, those days are over.
Now that it's 2026, companies are drowning in data. Excel is still great for quick math, but it completely chokes the second you throw millions of rows of live customer data at it. That’s exactly why Python is now the baseline skill for business analysts.
But here’s the part that terrifies most business students: you don’t need to be a software engineer or a math wiz. At Learnhub Education, we tell our students to stop looking at Python as some scary programming language and see it for what it actually is—just a massively powerful calculator.
Here is how Python actually works in real jobs, the very few tools you actually need to learn, and a realistic plan to get started.
Why is Every Business Demanding Python?
You might be thinking, "Why can't I just stick to Power BI or SQL?" Look, you should absolutely learn those too, but Python handles things they just can’t touch.
A modern business analyst isn't just looking backward at last quarter's sales. They're trying to predict next month’s trends, automate daily grunts, and read messy text like customer reviews.
It handles massive files: Try opening a file with two million rows of transaction data in Excel. Your laptop will freeze, turn into a radiator, and crash. Python doesn’t care about file size. It crunches through millions of data points in two seconds.
It kills boring automation: Think about how much time interns waste every Monday morning. Downloading the same CSV files, cleaning up broken date formats, and copying it all into PowerPoint. With Python, you write a short script once, hit a button, and go grab a coffee while it does the work for you.
The Essential Python Toolkit (Ignore Everything Else)
Open any standard Python textbook and you'll see thousands of concepts you will never, ever use. You aren't building video games. You just need a few specific libraries that do the heavy lifting for data.
Pandas and Polars
Before analyzing anything, you have to clean the data. Real corporate data is incredibly messy—full of missing rows, typos, and weird formatting.Pandas is your bread and butter here. Think of it as a spreadsheet where you type commands instead of clicking buttons. You can filter or merge data in a line or two of code. Lately, everyone is also jumping onto Polars. It does the same thing but it’s blazing fast on massive datasets.
Seaborn and Plotly
No boss wants to stare at raw code or massive tables. They want the story behind the numbers. For quick, clean charts, Seaborn is perfect. It builds nice heatmaps or charts without making you tweak a million design settings. If you want to look like a rockstar in a meeting, use Plotly. It creates interactive charts where people can hover over data points or zoom in on specific dates right in their browser.
Scikit-Learn
This sounds intimidating because it’s a "machine learning" library, but for an analyst, it’s just a tool for making highly educated guesses. You use it to run basic models to forecast sales, see which customers are about to cancel subscriptions, or price a product based on past trends.
What This Looks Like in Real Departments
Here is how people actually use this stuff on the clock:
In Marketing: Instead of reading thousands of tweets or reviews one by one, a Python script scans the text and instantly tells you what percentage of people are happy, angry, or confused about a launch.
In Finance: Teams use Python to automate budgeting. Instead of manually updating spreadsheets for every single department, a script pulls live spending data, flags weird transactions that look like fraud, and updates forecasts instantly.
In Supply Chain: It’s all about timing. Analysts use Python to look at years of sales data alongside weather or shipping delays so they know exactly how much stock to keep in the warehouse without wasting money.
A Realistic, Step-by-Step Learning Plan
Don't try to learn all of this in a weekend. It's a marathon. Here is the exact path we give beginners at Learnhub Education:
Phase 1: The Basics (Don't Rush)
Spend two weeks just getting used to how Python thinks. Learn variables, basic "if-else" logic, and how to use loops to repeat tasks. Don't worry about data science yet; just get your code to run without errors.
Phase 2: Play with Messy Data
Go to Kaggle, find a free, messy dataset—like an old e-commerce sales sheet. Force yourself to open it, clean up the missing rows, calculate total sales by region, and filter out the bad data using Pandas. This is where you'll spend 70% of your actual job.
Phase 3: Learn to Visualize
Take that clean data and start making charts. Map out sales trends over time or where your biggest customers live. Keep the charts simple and easy for a non-technical manager to understand at a glance.
Phase 4: Build Something Real
Stop watching tutorials. Pick something you actually care about—analyze your own Spotify listening data, track local housing prices, or look at stock trends. Put it on GitHub, write down what you learned, and stick it on your resume.
Keep the Right Mindset
The biggest mistake students make is trying to memorize code. Please don’t do that. Even senior developers look things up on Google every single day.
The real skill isn’t memorizing syntax; it’s looking at a messy business problem and breaking it down into smaller questions data can answer. Python is just the tool you use to type out those answers. Keep practicing on real data, and you’ll easily stand out.
Want to build your very first real-world data project? Check out our beginner-friendly programs at Learnhub Education. We skip the academic jargon and focus entirely on the practical skills that actually get you hired.
FAQs:
1. Do I really need Python if I’m already amazing at Excel?
Honestly? Yes. Excel is great for quick math or looking at a small table. But the second a company hands you a file with millions of rows—like live web traffic or raw sales logs—Excel will just freeze your laptop. Python doesn't care about file size, and it lets you automate the boring stuff you hate doing every Monday morning.
2. I have zero coding background. Can I actually learn this?
100%. You aren't trying to become a software engineer building mobile apps or video games. For business stuff, Python is literally just a super-powered calculator. If you can understand basic logic (like, "If a customer spent over $500, label them a VIP"), you can easily learn to use Python for data.
3. How long will it take me to actually get good at this?
If you spend about an hour a day messing around with real datasets, you’ll get comfortable with the basics and cleaning data in about two months. Don't try to cram it all in a weekend. It's like going to the gym—it’s about building muscle memory, not memorizing definitions.
4. What's the deal with Pandas vs. Polars? Which one matters?
They do the exact same thing: opening, cleaning, and filtering spreadsheets using code. Pandas is the old reliable tool that almost every company still uses. Polars is the newer one built to handle massive data way faster. Just learn Pandas first—once you know it, switching to Polars takes like a day.
5. Why use Python when tools like Power BI and Tableau exist?
Power BI and Tableau are great for building the final dashboards your boss looks at. But Python is what you use before that step. You use it to clean up messy text, patch up missing data, or run predictive models to see where sales are heading. They work together, they don't replace each other.
6. Do I need to be a math or stats genius?
Not at all. The Python libraries do all the heavy lifting and math formulas behind the scenes. As a business analyst, your job isn't to calculate formulas by hand; your job is to look at the chart Python spits out and explain what it means for the business in plain English.
7. How do I practice without getting incredibly bored?
Stop watching endless YouTube tutorials and pick a dataset about something you actually like. If you love music, pull your Spotify data. If you're into sports, download NBA or Premier League stats. Cleaning and charting data you actually care about makes learning way faster.
8. What is Scikit-Learn, and should I be scared of it?
It sounds intimidating because it’s labeled as a "machine learning" library, but for an analyst, it’s just a tool for making highly educated guesses. You use it for simple tasks, like looking at past user data to figure out which customers are most likely to cancel their subscriptions next month.
9. Am I supposed to memorize all this code?
Absolutely not. Even senior analysts and developers look up code on Google or Stack Overflow every single day. The real skill is knowing what you want to do with the data. You can always look up the exact syntax or line of code to make it happen.